The Metrics Revelations
Imagine this scenario: you and a friend decide to go to a movie. You walk into the theater where 5 movies are playing. You and your friend know absolutely nothing about any of the movies that are at that theater. How do you decide which one to see? Do you blindly pick one based on how catchy the title is? Do you flip a coin? Do you spin around until you’re dizzy, close your eyes, and walk up to a poster to determine which one you see?
That seems like a waste of a $15 movie ticket to me (more, if you also spring for popcorn and a soda).
The point is this: you need more detail about each of those movies to make an informed decision about which one deserves your money.
The same is true in marketing. It’s hard to know which tactics to employ in a marketing campaign if you don’t have any reliable metrics in which to guide your decision.
The sad truth is that most small-business marketers don’t have the metrics they need, or aren’t sure what to do with the information they have. The good news is that with the continual growth of digital marketing platforms, getting a hold of these metrics is becoming easier.
Dan’s last blog discussed the value of reviewing metrics post-campaign, and distilled it down to the most basic, core ones that are relevant for most businesses. This is your starting point for evaluating the health of your marketing campaign.
Facebook, Google Analytics, Google Search Console, and Google Business pages all offer deeper dives into how your potential customers are interacting with your brand.
Installing the Facebook pixel in the header of your website feeds valuable and insightful information back to Facebook about your customers. With this information, you can drill down to weekly, monthly, and daily users; look at active users by hour for each day of the week; build funnels to see how visitors are traveling through a desired set of actions or parse out greater detail about data; look at device overlap from phone vs desktop vs tablet; and view visitor demographics.
Yes, some of this overlaps with data from other sources like Google Analytics. But viewed together, you can build a clearer picture of your audience – the most active times on your Facebook page, whether they view your page from multiple devices or only a singular one, and what sort of retention you have on your page and ads.
This information can help you build a strategy on your next Facebook campaign, or even just regular posts, by targeting when your audience sees that information, whether it’s mobile-optimized, and where geographically to target your ad.
Google Analytics
Analytics is the old stand-by for website metrics. You’ll get all the standard traffic, landing pages, top pages, and other engagement metrics that Google has been providing for years. However, with the FB pixel installed and by selecting Analytics to report on demographics and more detailed visitor data, you’ll get a deeper dive into the site users.
Aside from measuring behavior paths through the site and what pages stack up where, you’ll get substantially more psychographic information about your users. Analytics now provides detail on Affinity Audiences, In-Market Audiences, and what they lump into “Other” Audiences.
- Affinity Audiences analyze someone’s overall interests, passions, and lifestyle to get a better sense of their overall identity. View Affinity Audiences as individuals who have a general, long-standing interest for a specific Affinity Segment.
- An In-Market Audience is composed of folks who are actively searching and comparing your product/service. Individuals in this audience have indicated that they are actively in-market for a specific category such as “Employment” or “Real Estate” or “Travel” or any of the other audiences currently available from Google. View In-Market Audiences as individuals who are temporarily interested in a specific In-Market segment.
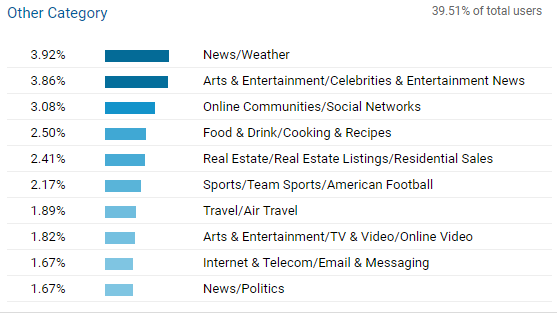
- Other Category classification provides a more focused view of the type of content users are interested in compared to the Affinity Categories. Note that a single visit can be classified in multiple categories, and one visit could be also counted multiple times in the visit metrics in these reports.
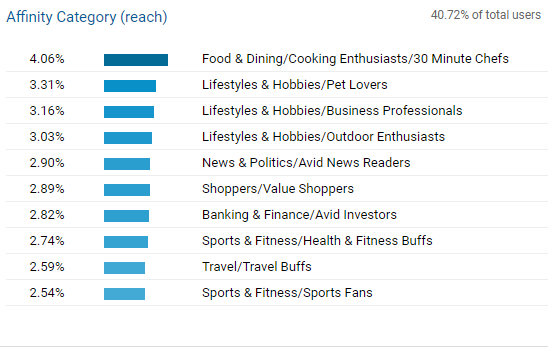
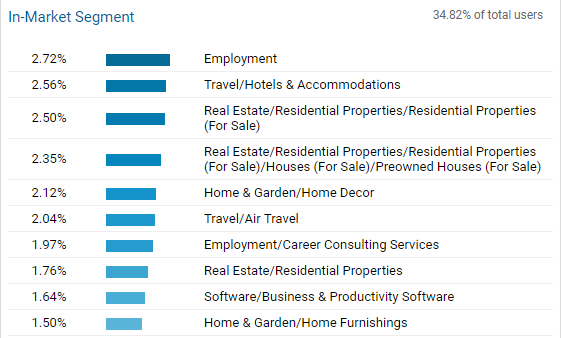
This level of detail into your audience helps build out the profile of who you’re reaching and who you should be talking to. These people are engaged in your brand. Make sure you’re meeting them where they are – and use this information as a guide on where you should be.
Google Search Console
Search Console, formerly Webmaster Tools, is the complementary Google product to Analytics. In Console, you can (and should!) submit sitemaps to trigger Google to index your site. Console, though, holds the key to HOW people are finding you based on keywords. You’ll get a comprehensive list of the keywords used in which your website appeared in the search results. The data will let you know the keyword, the number of impressions, the number of click-throughs, and the average position in which you appeared.
You’ll find that the keywords fall into two categories: branded and non-branded. Branded keywords are terms people used with your name to get to your site. In our experience, these keywords aren’t the most helpful as people already know you and are looking for you specifically. The non-branded keywords of people looking for “widgets near me” are the most helpful ones. The terms used here should be reflected in your website and any social media as that’s how people are talking about it. They’re looking for “water”, not “dihydrogen monoxide”.
Google Business
By now, your Google Business page should be claimed and set up with all of your business’s relevant details: hours, location, logo, services, description, website, etc. Once that’s set up, Google will offer insights on how many times you’ve showed up in web searches, map searches, how many people clicked-to-call your phone number, and the busiest days and times you were displayed in results. These results alone are merely directional, but taken in context with the other metrics, provide a clear, visual representation of basic data based on search results.
Media-Specific Metrics
Anytime you engage digital media to distribute ads, there are metrics associated with that. Whether it’s Google Adwords (Pay Per Click), Pandora or Spotify radio, or other digital platforms, the results should provide a clear indication of what keywords are working, what isn’t, and the level of engagement.
The Result
Yes, there are several places you have to go to find the metrics you need to make informed business decisions (oh, by the way, they’re all FREE), but the end-result is that those learnings drive future efforts and improve the efficacy and efficiency of marketing efforts down the road. The clearer the picture of who your target audience is, where they are, how they get there, and what they do to engage with your brand, the stronger your marketing will be.
The important thing to keep in mind is that the picture you’re painting of your audience is never done; rather, your audience is constantly evolving, just as your brand should be evolving, too. These metrics and all the associated data are guides. They aren’t gospel. They can change, or be flawed, or sometimes be contradictory, but they should always provide a gauge of performance and insights into how to improve your efforts going forward. They are directional feedback, not always and not necessarily literal feedback.
The more you know about your audience, or keywords, or device or anything else that’s important to you, the smarter you can be about spending your budget.
That’s the data you should review in combination with other data you find interesting or helpful and build your tactical marketing plan from that. Much like with movies, you have a preference of action vs comedy, one actor vs another, etc. Those matter to you for the $15 you’ll spend on the movie. You need to determine what those important preferences are for your brand and find out as much as you can in those categories before you spend far north of $15 in your marketing.